4D City
Project Leader
Xiaoxiang Zhu
Contact Person
Xiaoxiang Zhu, Yuanyuan Wang
Cooperation Partners
German Aerospace Center (DLR)
State Key Laboratory of Information Engineering in Surveying, Mapping and Remote Sensing (LIESMRS), Wuhan University, China
Computational resource supported by
Leibniz Supercomputing Centre, Gauss Centre for Supercomputing
Click here for the project page
Since VHR D-TomoSAR of urban infrastructure is a new research area, the development and improvement of appropriate robust TomoSAR algorithms will be the first focus of the project. Second, data fusion for combining the strengths of different sensors will be developed both on the geodetic and the semantic levels. Finally, a particular challenge will be the user specific visualization of the 4D multi-sensor data showing the urban objects and their dynamic behaviour. Visualization must handle spatially anisotropic data uncertainties and possibly incomplete dynamic information. It may also integrate some of the data fusion steps. Different levels of user expertise must be considered.
Operational TomoSAR
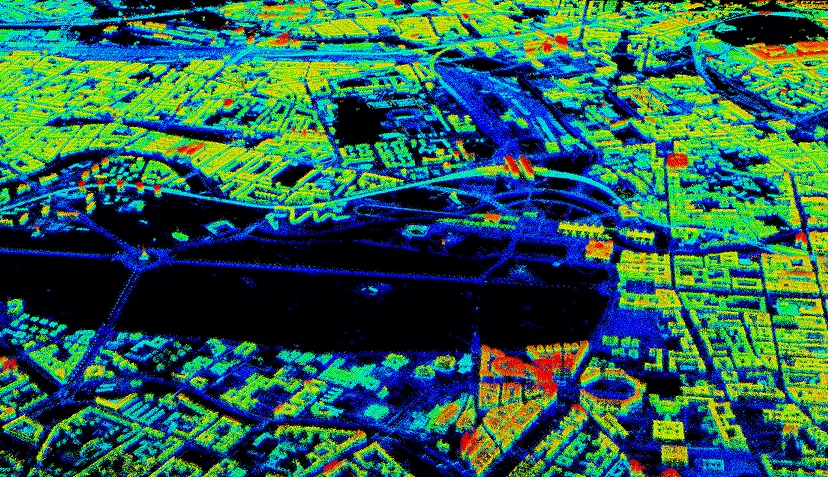
Based on the TomoSAR inversion algorithms SVD-Wiener and SL1MMER developed by Dr. Xiao Xiang Zhu, we have implemented a computationally efficient TomoSAR inversion algorithm by integrating persistent scatterer interferometry to the TomoSAR inversion. Figure 1 shows the first TomoSAR 3-D reconstruction of an entire urban area using meter-resolution spaceborne sensor. The point cloud contains points from an ascending and a descending viewing angle. TomoSAR point cloud fusion algorithm was also developed to combine the two point clouds of different viewing angles. Behind each point, the linear deformation rate and amplitude of seasonal motion caused by temperature change are also estimated.

TomoSAR and Optical Image Fusion
We developed an algorithm to co-register TomoSAR point cloud to a reference 3D point cloud, such as point cloud from optical stereo reconstruction or LiDAR. Particularly, by finding the position of the TomoSAR point in the coordinate system of the optical images, the TomoSAR point can be textured with optical information. This is shown in Figure 2 (left) which is the first TomoSAR point cloud textured with optical information. Figure 2 (right) is an extension of the approach by labeling TomoSAR points with their semantic class (in this case, the railway), in order to systematically perform urban infrastructure monitoring. The semantic classification is performed on the optical image and then translated to the TomoSAR point through the co-registration method.

Scientific Visualization
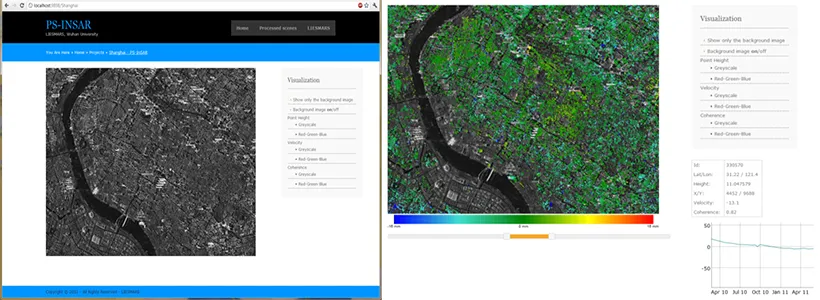
In the visualization part, we have developed a web-based interactive visualization tool for TomoSAR point clouds, in order to give non-experts a deeper understanding of the point clouds and help to better analyze the results. Using HTML5 and WebGL, the web-based approaches ensure our visualization application can run freely on the Internet through modern browsers on multiple platforms. Figure 3 (left) shows a screenshot of the web interface. The web interface also allows the user to examine detailed information of the deformation behavior of certain points. By clicking on points of interest, this information can be provided, as shown in Figure 3(right), where the right hand side shows the deformation history and other necessary information of the point.

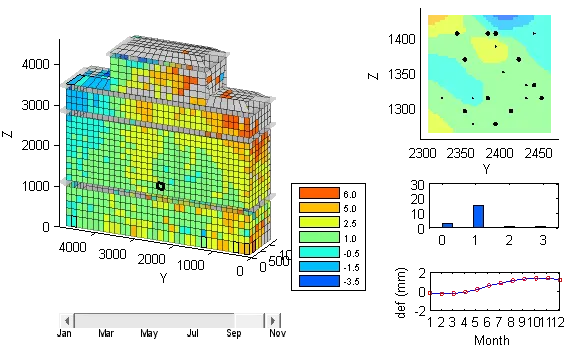
We also focused on visually analysis of 4-D space-time building deformation, and developed an interactive visualization system (shown in Figure 4). Users can perceive the overall deformation distribution of the building from the left part of the user interface. The users can interactively select a specific cell on the surface to explore detailed information. On clicking one cell, its detailed deformation information will be displayed on the right hand side of the window where we can see the spatial distribution of the TomoSAR points in the cell, the histogram of the deformation parameters, and most importantly, the time series of the average displacement of the cell.
