GGMplus 200m-resolution maps of Earth's gravity field
General
The Global Gravity Model plus, (GGMplus, cf. Hirt et al. 2013) is the result of a joint research initiative by Curtin University (Perth) and TU Munich (TUM), supported by the Australian Research Council, the TUM Institute of Advanced Study and the Western Australian iVEC supercomputing facility.
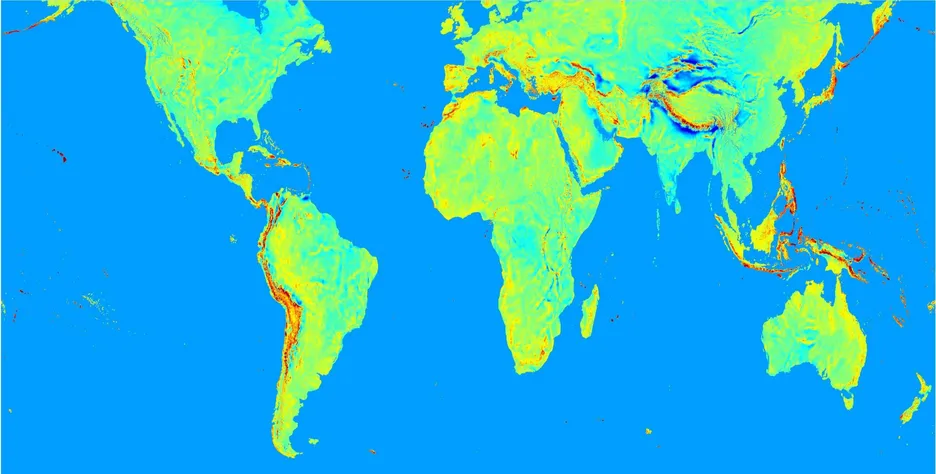
GGMplus provides maps and data of Earth’s gravity at 200 m resolution for all land and near-coastal areas of our planet between +- 60 degree latitude. Past gravity field modelling efforts either placed focus on global coverage with limited resolution or on representation of local detail over regionally limited areas. GGMplus is the first model of Earth’s gravity field to reach local resolution with near-global coverage, thus uniting both foci.
GGMplus describes the Earth’s gravity field in terms of frequently used functionals (i) gravity accelerations, (ii) gravity disturbances, (iii) North-South and East-West deflections of the vertical, and (iv) quasigeoid heights at 3,062,677,383 points at 7.2 arc-sec spatial resolution, offering unprecedented detail for areas such as the Himalayas (Fig. 1).
Download and citation
The GGMplus gridded data sets can be freely downloaded from
http://ddfe.curtin.edu.au/models/GGMplus/ (or its mirror at: https://ddfe.blazejbucha.com/models/GGMplus/)
where further information, continental visualisations and a making-of video are available. Please consult the README file for details on the products available and data formats.
The development of the GGMplus model is described in detail the paper
Hirt, C., S.J. Claessens, T. Fecher, M. Kuhn, R. Pail, M. Rexer (2013), New ultrahigh-resolution picture of Earth's gravity field, Geophysical Research Letters, Vol 40, doi: 10.1002/grl.50838 PDF
Input data and model development
GGMplus has been constructed as a composite of GRACE and GOCE satellite gravity, EGM2008 and short-scale topographic gravity effects. The model was developed using advanced computing resources and evaluation methods, which reduced the equivalent of about 80 years of standard CPU time to less than 2 months processing time to create GGMplus
GGMplus is a composite gravity field model that is based on GRACE and GOCE information (providing the spatial scales of 10000 down to ~100 km), EGM2008 (scales of 100 km to ~10 km) and topographic gravity effects from RTM-forward-modelling (~10 km to ~250 m). In particular, GGMplus incorporates (a) 7 years of GRACE satellite data (ITG2010s by University of Bonn, Mayer-Guerr et al. 2010) (b) 2 years of GOCE satellite data (4th-generation TIM-4 release by European Space Agency, Pail et al. 2011), (c) The EGM2008 global gravity model (by US National Geospatial Intelligence Agency, Pavlis et al. 2012), (d) 7.5 arc-sec SRTM topography data (V4.1 release, Jarvis et al. 2008) and (e) 30 arc-sec SRTM30_PLUS bathymetry data (V7.0 release, Becker et al. 2009) over near-coastal areas.
GRACE/GOCE and EGM2008 were combined and evaluated at the Earth’s topography in spectral band 2 to 2190 using the gradient approach to fifth-order (Hirt 2012). SRTM topography and SRTM30_PLUS bathymetry were high-pass filtered and used as data source for forward-modelling of short-scale gravity effects using a variant of the RTM approach (Hirt 2013). The short-scale gravity field constituents are available under the model name ERTM2160. The conversion of high-pass-filtered topography/bathymetry to gravity effects required brute-force numerical prism integration of gravity-effects (Forsberg 1984). This task was accomplished through massive parallelisation and use of advanced computational resources of the iVEC supercomputing facility. For further information on the construction of GGMplus see the paper by Hirt et al. (2013).
Results and impressions
The panels in Fig. 2 show the five GGMplus gravity functionals (1) gravity accelerations, (2) gravity disturbances, (3) North-South vertical deflection, (4) East-West vertical deflection and (5) quasigeoid heights over the Mount Everest area. The five functionals are available at 3,062,677,383 points with 7.2 arc-sec spatial resolution over the area shown in Fig. 3.
Spectral characteristics
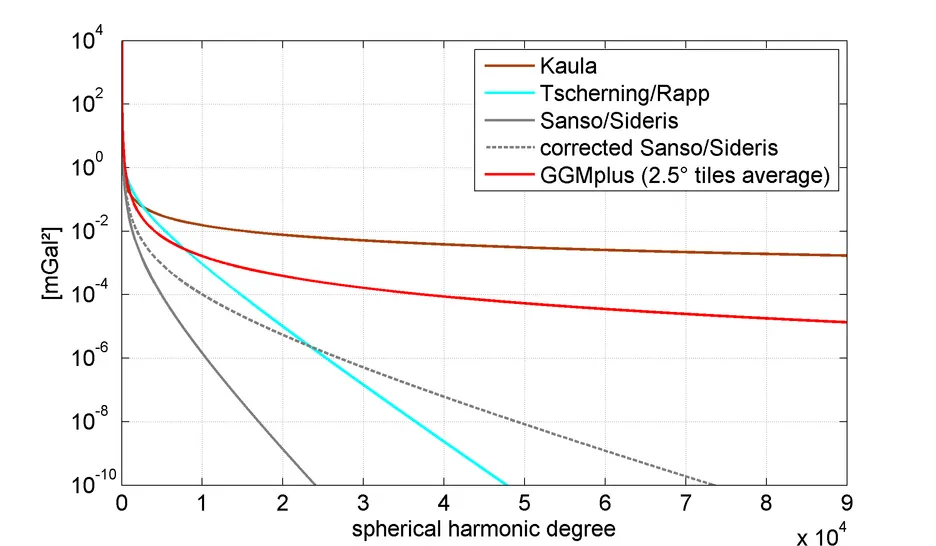
Recently a first step towards a spectral representation of GGMplus was made by Rexer and Hirt (2015). Using approximative methods, the GGMplus gravity tiles were spectrally analysed using discrete Fourier techniques in order to derive a degree variance model. The new model, given by
describes the decay of gravity signals to about harmonic degree ~90,000 based on the ~3 billion GGMplus data points (Fig. 4). As such, the GGMplus degree variances have to be interpreted carefully, as they describes the signal as found at the Earth's surface and not at the reference sphere (as in the other models display in Fig. 4) and because the assumptions made in the 2D-DFT analysis procedure allow to retrieve a global spectra with a 10% error margin, only.
For further details see the paper describing the new GGMplus degree variance model:
Rexer, M, and C. Hirt (2015), Spectral analysis of the Earth's topographic potential via 2D-DFT - a new data-based degree variance model to degree 90,000, Journal of Geodesy, 89(9), 887-909, doi: 10.1007/s00190-015-0822-4. PDF
Acknowledgement
This work has been supported by the Australian Research Council (Grant DP120102441), the TUM Institute for Advanced Study and and Western Australia’s iVEC supercomputing facility. All data providers are kindly acknowledged.
Contact
Dr. Christian Hirt, Dr. Moritz Rexer
References
Becker et al. (2009) Global Bathymetry and Elevation Data at 30 Arc Seconds Resolution: SRTM30_PLUS. Marine Geodesy 32(4), 355-371.
Forsberg R (1984) A study of terrain reductions, density anomalies and geophysical inversion methods in gravity field modelling. Report 355, Department of Geodetic Science and Surveying, Ohio State University, Columbus.
Hirt C. (2012) Efficient and accurate high-degree spherical harmonic synthesis of gravity field functionals at the Earth's surface using the gradient approach. Journal of Geodesy 86(9), 729-744.
Hirt C. (2013) RTM gravity forward-modeling using topography/bathymetry data to improve high-degree global geopotential models in the coastal zone, Marine Geodesy 36(2), 1-20.
Hirt, C., S.J. Claessens, T. Fecher, M. Kuhn, R. Pail, M. Rexer (2013) New ultrahigh-resolution picture of Earth's gravity field, Geophysical Research Letters, Vol 40, doi: 10.1002/grl.50838
Jarvis A, Reuter HI, Nelson A Guevara E (2008) Hole-filled SRTM for the globe Version 4. Available from the CGIAR-SXI SRTM 90m database: srtm.csi.cgiar.org
Mayer-Gurr T, E Kurtenbach, A Eicker (2010) The ITG GRACE 2010 model, www.igg.uni-bonn.de/apmg/index.php.
Pail, R. et al. (2011) First GOCE gravity field models derived by three different approaches, Journal of Geodesy 85(11), 819-843.
Pavlis, N.K., S.A. Holmes, S.C. Kenyon, and J.K. Factor (2012) The development and evaluation of the Earth Gravitational Model 2008 (EGM2008). Journal of Geophysical Research 117, B04406.
Rexer, M, and C. Hirt (2015), Spectral analysis of the Earth's topographic potential via 2D-DFT - a new data-based degree variance model to degree 90,000, Journal of Geodesy, 89(9), 887-909, doi: 10.1007/s00190-015-0822-4.


